The LTV to CAC ratio compares what a customer is worth against what they cost to win. Three to one is the working benchmark but a ratio that is too high is a warning too, because it usually means you are underinvesting in growth.
Two companies can spend the same on acquisition and have completely opposite futures. The difference is not the spend. It is what each customer gives back.
The LTV to CAC ratio puts those two numbers side by side. This guide covers the formula, the benchmarks, and the traps that make the number lie.
What is the LTV to CAC ratio?
The LTV to CAC ratio is customer lifetime value divided by customer acquisition cost. An LTV of £15,000 against a CAC of £5,000 gives a ratio of 3:1 each customer returns three times what they cost to win.
It answers the only question that ultimately decides whether growth is worth funding: are you buying revenue for less than it is worth? Every other acquisition metric is a detail beside that one.
The benchmarks, and what they mean
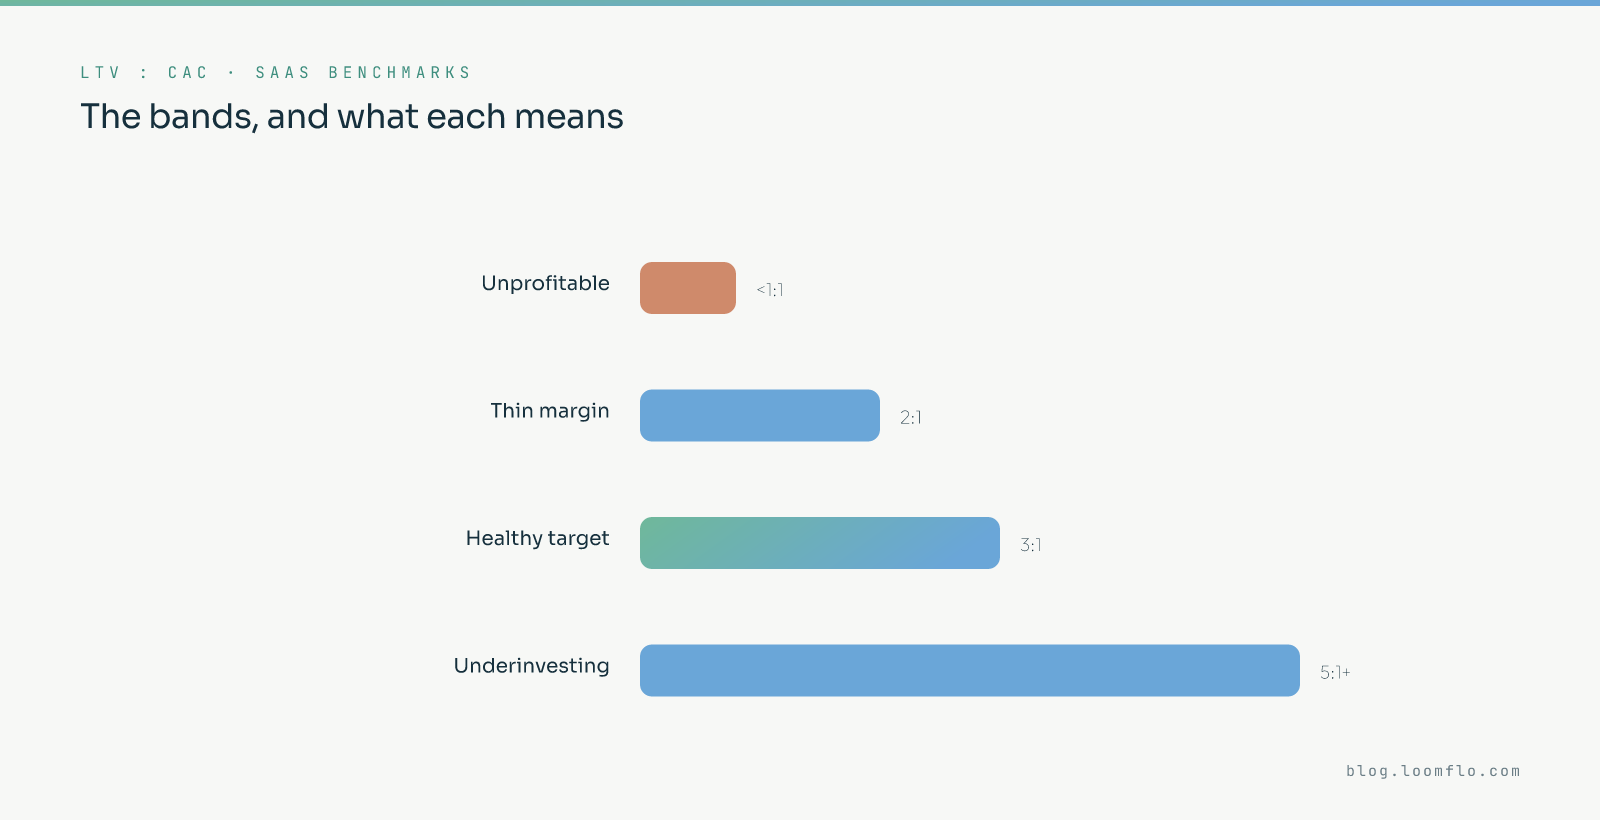
The ratio is read in bands, not as a single target. Each band tells you something different about what to do next.
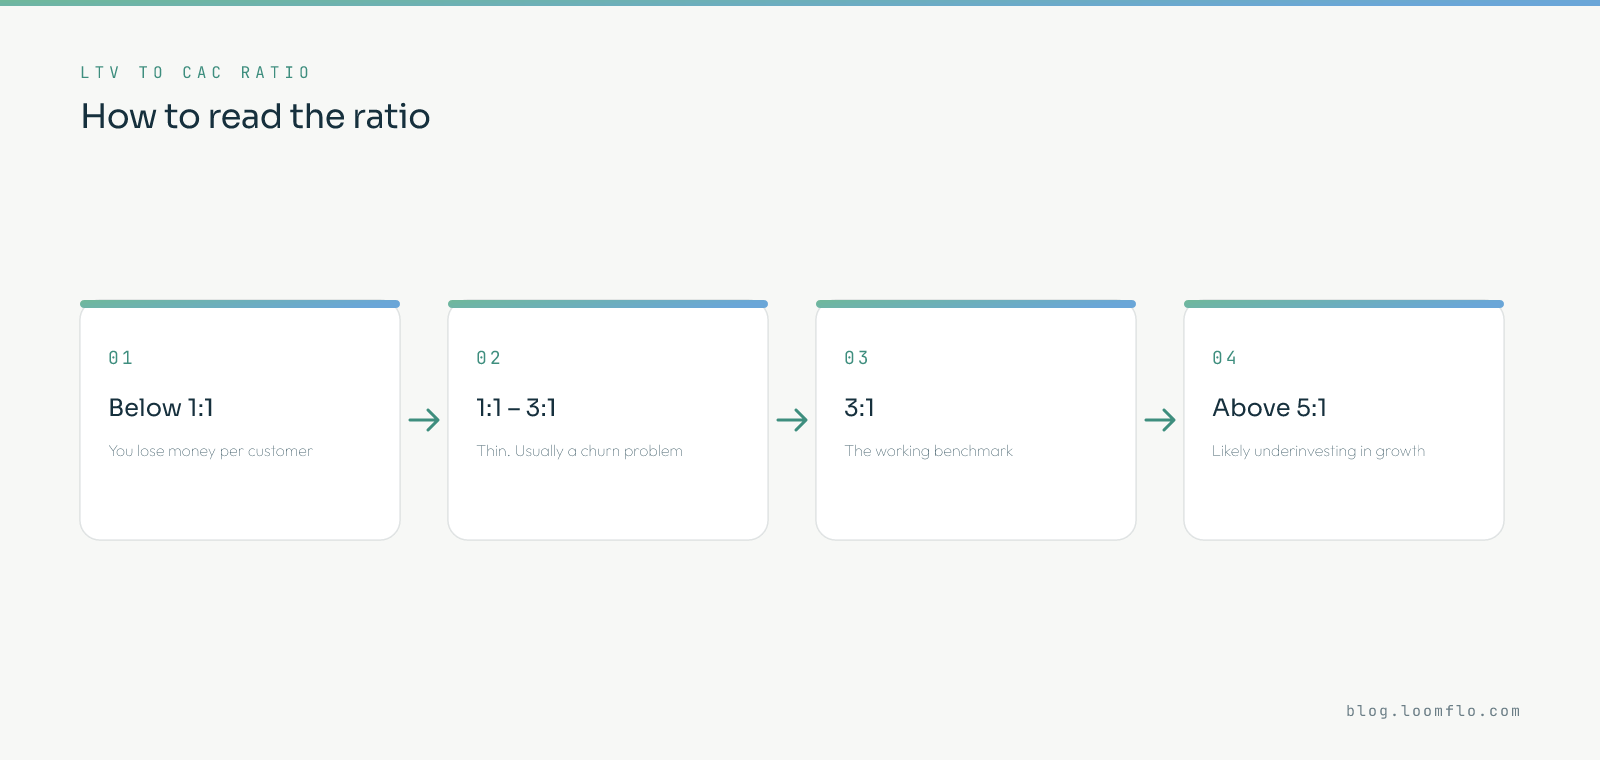
Below 1:1 — you are paying to lose customers
Every customer costs more than they return. Growing faster makes it worse, not better.
1:1 to 3:1 — thin
The model works but leaves almost nothing for product, support and overhead. Usually a retention problem rather than an acquisition one.
3:1 — the working benchmark
The widely used healthy target. Enough margin to fund the business and reinvest without the model straining.
Above 5:1 — usually underinvesting
The counter-intuitive one. A very high ratio often means you are leaving growth on the table — you could profitably spend more to acquire and are choosing not to.
Why a high ratio is not a win
This is the part most teams get wrong. They treat the ratio as a score to maximise, when it is really a balance to hold.
At 8:1 you are extracting a lot from every customer you win. You are also almost certainly acquiring fewer of them than you could. A competitor sitting at 3:1 is spending more per customer, growing considerably faster, and will own the category while you protect a beautiful spreadsheet.
The exception is a deliberate one if capital is expensive or you are steering toward profitability, a high ratio is a choice rather than a mistake. Just make sure it is a choice.
Payback period: the missing half
The ratio has no sense of time, and time is what kills companies. A 3:1 ratio realised over six years is not the same business as a 3:1 realised over eighteen months.
The median B2B software company takes around 16 months to earn back its acquisition cost (First Page Sage). Under twelve months, growth largely funds itself. Past twenty-four, you are financing every customer for two years and the ratio will not save you from the cash-flow squeeze.
Always read the two together. A healthy ratio with a long payback is a fundraising problem waiting to happen.
How to improve the ratio
There are only two levers, and one of them is far cheaper than the other.
- Raise LTV first: Better retention and expansion lift the numerator without adding spend. Keeping a customer costs five to twenty-five times less than winning a new one (HBR).
- Target better, not harder: Good-fit accounts convert faster, churn less and expand more that improves both sides of the ratio at once.
- Fix the leaks before buying more traffic: Improving conversion lowers effective CAC without touching the ad budget.
- Segment the ratio: A blended figure hides the channel quietly running at 1:1 and the one running at 6:1.
- Recalculate quarterly: Both inputs drift, and a stale ratio justifies the wrong decision with confidence.
Common mistakes
Most bad ratios are measurement problems before they are business problems.
- Using revenue instead of gross margin in LTV: The most common error, and it inflates the ratio badly for anyone with real cost of delivery.
- Leaving salaries out of CAC: CAC includes the sales and marketing people, not just the ad spend.
- Guessing lifetime: Young companies rarely have the churn history to know it, so the honest move is a conservative estimate rather than an optimistic one.
- Blending everything: One company-wide number tells you nothing about where to move budget.
- Treating it as a scoreboard: Chasing a bigger ratio can quietly mean choosing to grow slower.
How AI moves both sides
Automation is useful here because it works on the numerator and the denominator at the same time.
On CAC, better targeting and instant lead response convert more of the traffic you already paid for, which lowers the effective cost per customer without lifting spend. Predictive qualification keeps sales time on accounts that can actually close.
On LTV, behavioural monitoring flags at-risk accounts early enough to save, and expansion signals surface the customers ready to buy more. The honest caveat: automation cannot rescue a fundamentally weak offer. If churn is high because the product does not deliver, the ratio is telling you something no tool will fix.
Where the ratio fits
The ratio is the summary line of your unit economics. It only means anything if the two inputs feeding it are honest.
Read it alongside its components customer lifetime value on top, customer acquisition cost underneath. And because retention drives the numerator hardest, customer retention is usually where the ratio is actually won.
Calculate it on margin, segment it, and read it next to payback. Then decide whether to spend more or fix the base.
Frequently asked questions
What is the LTV to CAC ratio?
It is customer lifetime value divided by customer acquisition cost. An LTV of £15,000 against a CAC of £5,000 is a 3:1 ratio, meaning each customer returns three times what they cost to win.
What is a good LTV to CAC ratio?
Around 3:1 is the working benchmark. Below 1:1 you lose money on every customer; between 1:1 and 3:1 is thin; above 5:1 usually signals underinvestment in growth rather than excellence.
Can the ratio be too high?
Yes. A ratio above 5:1 generally means you could profitably acquire more customers and are not. Unless you are deliberately steering toward profitability, that is growth you are choosing to skip.
Should LTV use revenue or gross margin?
Gross margin. Using revenue ignores the cost of serving the customer and inflates the ratio often dramatically for businesses with real delivery costs.
How does payback period relate to the ratio?
The ratio ignores time entirely. A 3:1 over eighteen months is a very different business from a 3:1 over six years. Median B2B SaaS payback is about 16 months; always read the two together.
How often should I recalculate it?
Quarterly, and always by segment and channel. Both inputs drift, and a blended company-wide figure hides the channels that are actually losing money.
Fix the ratio from both ends
Loomflo builds AI growth infrastructure sharper targeting and instant response to cut CAC, plus retention monitoring that lifts LTV.