Pipeline coverage ratio is open pipeline divided by quota. The familiar answer is 3x, but the correct answer is simply the inverse of your win rate if you close 20% of opportunities, you need 5x, and 3x guarantees you miss.
Every sales leader has been asked whether there is enough pipeline to hit the number. Most answer with a feeling. There is an arithmetic answer, and it takes one division.
This guide covers the pipeline coverage ratio formula, why the standard 3x rule is often wrong, and how to set a target that reflects your actual business.
What is pipeline coverage ratio?
Pipeline coverage ratio is total open pipeline value divided by the quota for the same period. A team with £3m of open opportunities against a £1m quota has 3x coverage.
It exists because pipeline is not revenue. Most opportunities do not close, so you need considerably more in play than you intend to win. Coverage tells you whether the surplus is big enough.
Why 3x is a rule of thumb, not a rule
The 3x figure is everywhere, and it is only right for teams that win about a third of their deals. It is a restatement of one specific win rate, not a universal law.
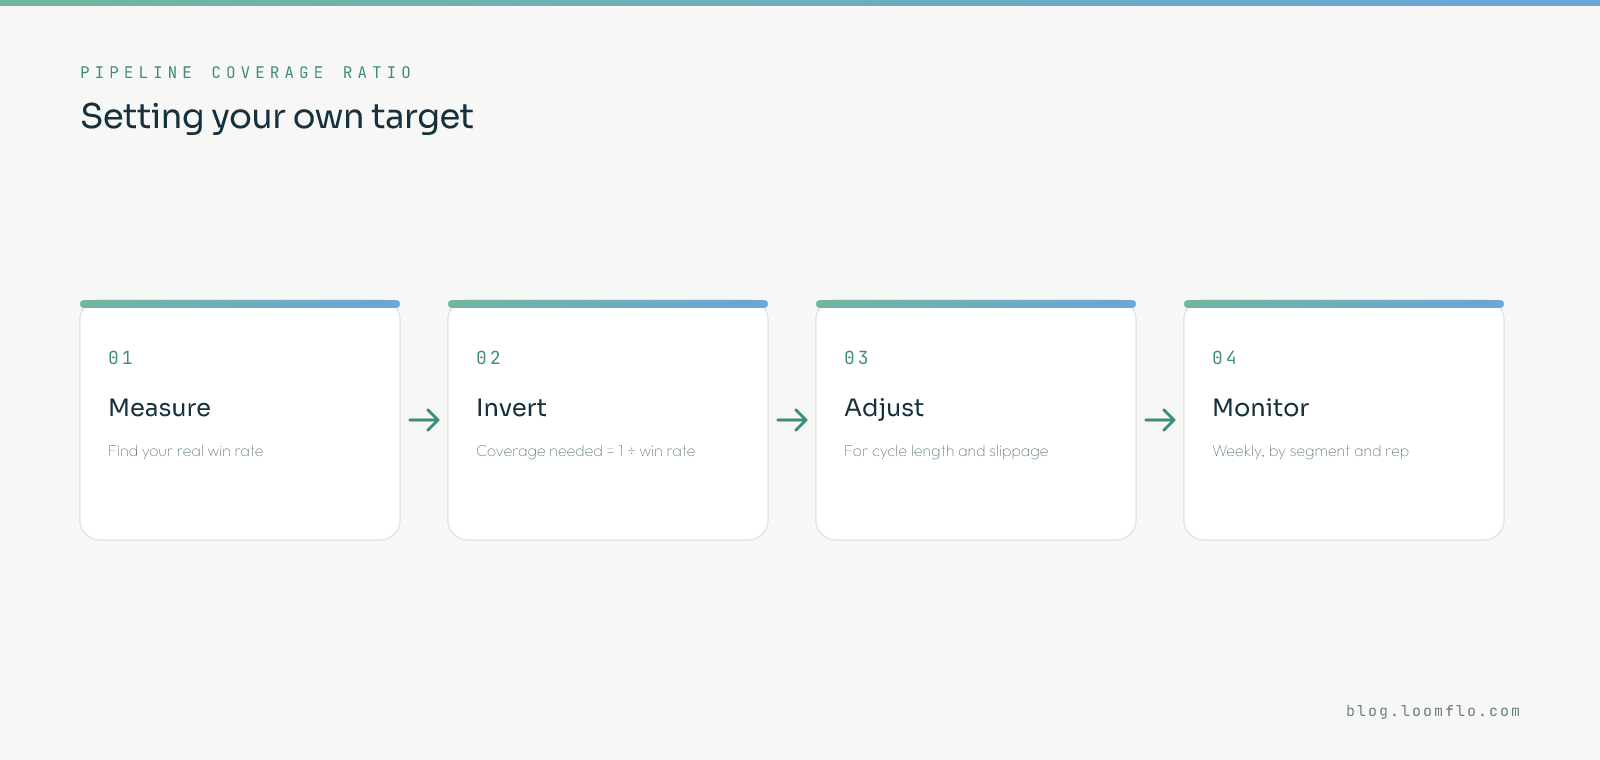
Start from your win rate
The baseline coverage you need is 1 ÷ win rate. Close 33% and you need 3x. Close 20% and you need 5x. Close 50% and 2x will do.
Adjust for cycle length
Deals that cannot possibly close inside the period should not count toward coverage for it. Long cycles need higher headline coverage because part of the pipeline is for next quarter.
Adjust for forecast honesty
If your stages are optimistic and deals routinely slip, add a buffer. The number is only as good as the pipeline hygiene behind it.
Monitor by segment
Enterprise and SMB have different win rates, so they need different targets. One blended ratio hides a shortfall in whichever segment converts worse.
What the arithmetic actually says
Held against real win rates, the 3x default turns out to be dangerous for a lot of teams.
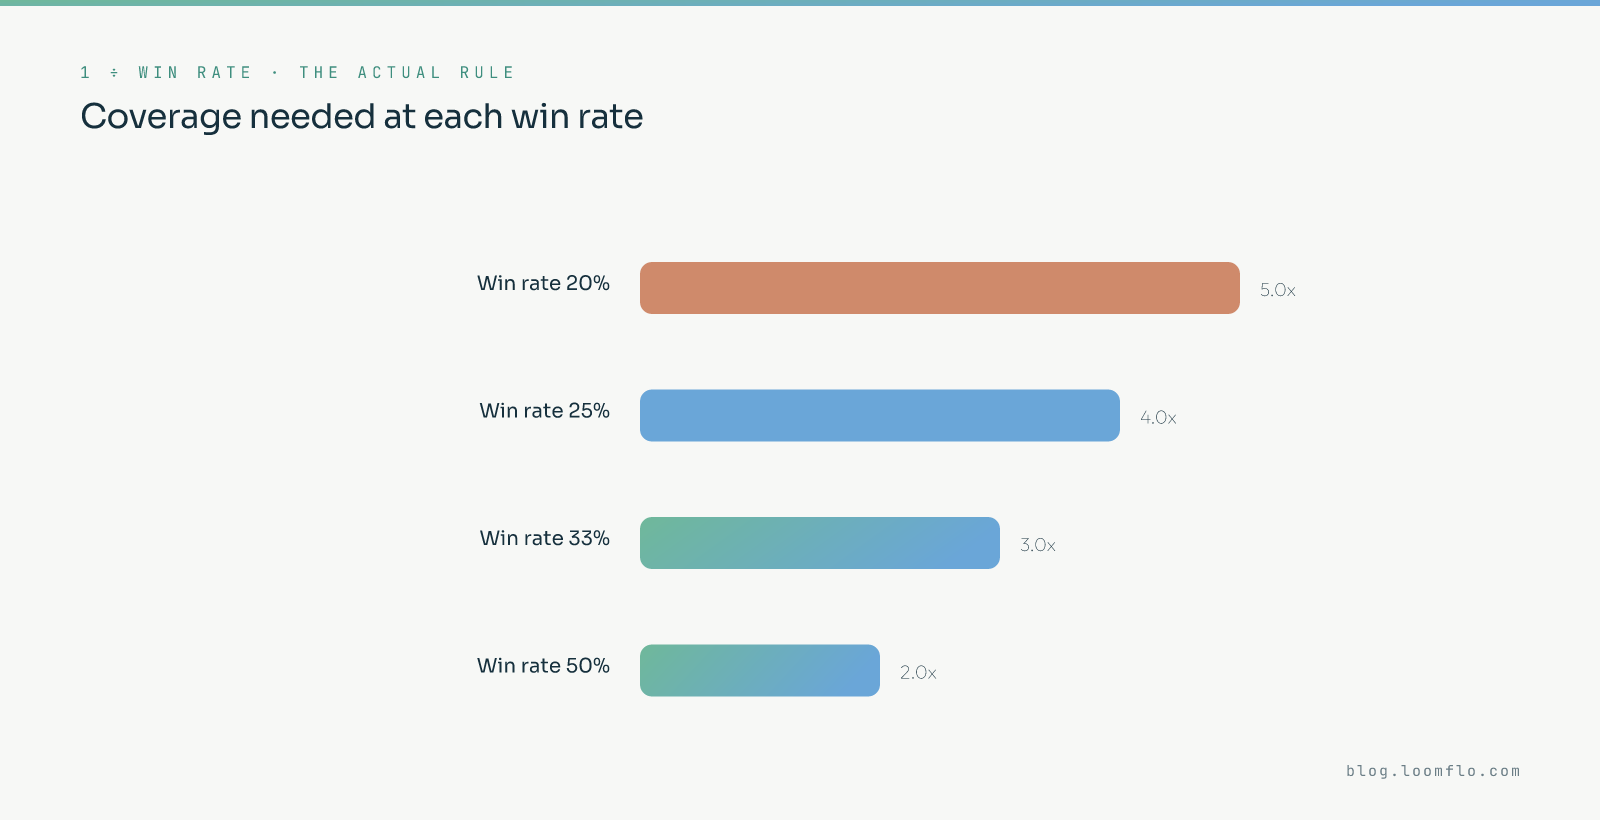
Typical B2B opportunity-to-win rates sit around 20–30%, which implies coverage nearer 3.3x to 5x than a flat 3x. A team closing 20% and carrying 3x coverage is planning to land at 60% of quota, and no amount of end-of-quarter effort fixes a gap that was set months earlier.
This is why coverage is a leading indicator. By the time the shortfall shows up in revenue, the window to generate pipeline for that period has already shut.
How to improve coverage
There are only two honest routes: more qualified pipeline, or a better win rate. Everything else is decoration.
- Raise the win rate: This lowers the coverage you need, which is easier than manufacturing pipeline. Tighter targeting is the usual mechanism.
- Generate earlier: Pipeline for a long-cycle quarter has to be created a quarter or more ahead. Coverage problems are almost always late-generation problems.
- Purge dead deals: Stale opportunities inflate coverage and hide the real gap. A cleaner, smaller number is more useful than a flattering one.
- Weight by stage: £100k at proposal is not £100k at discovery. Stage-weighted coverage is far more predictive than raw value.
- Check per rep: A team at 4x can contain reps at 1.5x. Averages hide the people about to miss.
Common mistakes
Coverage is one of the easiest metrics to accidentally lie to yourself with.
- Counting zombie deals: Anything untouched for a full cycle is not pipeline; it is hope with a close date.
- Using 3x because everyone does: If your win rate is not roughly a third, the number is simply wrong for you.
- Ignoring close dates: Deals scheduled beyond the period should not count toward it.
- Treating it as a target: Reps asked to hit a coverage number will create pipeline that satisfies the report and nothing else.
- Reviewing it quarterly: Too late to act. Coverage is a weekly number precisely because its value is early warning.
How AI keeps coverage honest
The weak point in coverage is never the division it is the quality of the pipeline being divided. That is where automation helps.
Predictive scoring on open opportunities replaces rep optimism with observed behaviour, so stage-weighted coverage reflects reality. The same models flag stalling deals early, which stops zombie opportunities quietly padding the ratio for months.
On the generation side, continuous intent monitoring and automated outreach smooth out the feast-and-famine cycle that creates coverage gaps in the first place. The honest caveat: no model invents demand. If coverage is short because the addressable market is small or the offer is weak, that is a strategy problem and it needs a strategy answer.
Where coverage fits
Pipeline coverage ratio is the forecasting counterpart to velocity. Velocity tells you how fast the pipeline converts; coverage tells you whether there is enough of it.
Read it alongside the metrics that feed it sales funnel stages shows where opportunities leak, lead scoring keeps the pipeline you count worth counting, and demand generation is what fills it far enough ahead to matter.
Invert your win rate, purge the zombies, and check it weekly. Coverage is only useful while there is still time to act on it.
Frequently asked questions
What is pipeline coverage ratio?
Pipeline coverage ratio is total open pipeline value divided by the quota for the same period. £3m of pipeline against a £1m quota is 3x coverage.
What is a good pipeline coverage ratio?
The inverse of your win rate. At a 33% win rate you need about 3x; at 20% you need 5x. The widely-quoted 3x default only suits teams closing roughly a third of their opportunities.
How do I calculate pipeline coverage?
Divide the total value of open opportunities with close dates inside the period by the quota for that period. For a more reliable figure, weight each opportunity by its stage probability first.
Why is 3x pipeline coverage not always enough?
Because it assumes a 33% win rate. Typical B2B opportunity-to-win rates run 20–30%, so a team at 20% carrying 3x coverage is mathematically on track for about 60% of quota.
How often should I review pipeline coverage?
Weekly. Its entire value is early warning, and by the time a quarterly review shows a gap, the time needed to generate pipeline for that quarter has already passed.
What is the difference between pipeline coverage and pipeline velocity?
Coverage asks whether you have enough pipeline; velocity asks how quickly that pipeline turns into revenue. Coverage is a forecasting check, velocity is a diagnostic for which lever to pull.
Know the gap while you can still close it
Loomflo builds AI growth infrastructure predictive scoring, stall detection and always-on pipeline generation that keep coverage real rather than reported.